5 Steps to Separate Science from Hype, No PhD Required
By Gabrielle Rabinowitz and Emily Jane Dennis
“Does flossing decrease my risk of heart disease?” No, but is it good for you? Yes.
“Does aluminum cause Alzheimers?” Nope.
“Should I start following the Paleo Diet?” Probably not & paleolithic people probably didn’t either.
As scientists, we’re asked these sorts of questions all the time. Although we’re trained to evaluate scientific ideas, it definitely doesn’t take a PhD to judge the latest craze or newest finding. To do it yourself, follow these 5 steps:
1. Separate the sales pitch from the science
Almost everyone is trying to sell something. In articles about science, the sales pitch is usually right in the headline. The science is harder to find.
Start by looking for a quote from a scientist. Read the quote but ignore the spin the author put on it. Don’t forget that scientists can have biases too: be skeptical of scientists who don’t acknowledge the limitations of their research and fail to present alternate explanations. Also, check to see who’s funding the research- they might have an agenda too!
In short, read articles carefully and figure out if the claims they make are based on the facts they present.
2. Find the data
Some articles will go beyond quotes and actually describe the studies behind their claims. If they don’t, or if you still want to learn more, use Google Scholar to look for the original source. Search with whatever information you have: the names of the scientists, their institution, or the main topic.
You’ll find some articles that are free and easy to read, but many that aren’t. Even if you can’t access or understand an article, you can still find out if the research was published in a reputable journal. Look for the ‘impact factor’ of the journal where an article was published (search for the journal name + “impact factor”). This number is only given to journals that have been around for at least three years and it reflects how often the papers in that journal have been referenced by other scientists. Look for an impact factor of 5 or higher when deciding if a journal is trustworthy.*
3. Evaluate the data
Once you find the data, it’s time to evaluate it. Check to see if the scientists behind the original claim, or another group of scientists, have repeated the experiments (and make sure the results were the same each time!). It’s also better if they analyzed hundreds or thousands of people (or monkeys, or cells, or anything else) instead of just two or three. Also keep an eye out for all the differences between two groups in a study, especially with humans. Things like income levels and access to health care can sometimes explain the reported results better than whatever the article is proposing.
Think about it this way: if you were in charge of figuring out the height of the average American male, you would need to measure a bunch of people to get it right. If you only measured a few people, and they happened to be basketball players, you’d be way off.
Also keep an eye out for misleading graphs. Graphs are great for communicating complicated information quickly, but they can also be misleading. Here are a few classic graphical tricks to watch out for:
The “put two things with the same trend on one graph” trick:
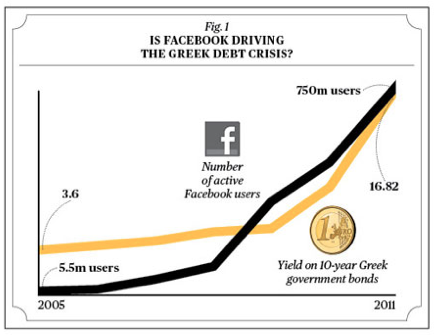
(source: Businessweek)
This one’s pretty obvious: correlation does not equal causation. It’s exaggerated, but it’s a good example of how putting two things on the same graph doesn’t mean they’re related… even if it looks like they might be.
The “take out data points” trick:
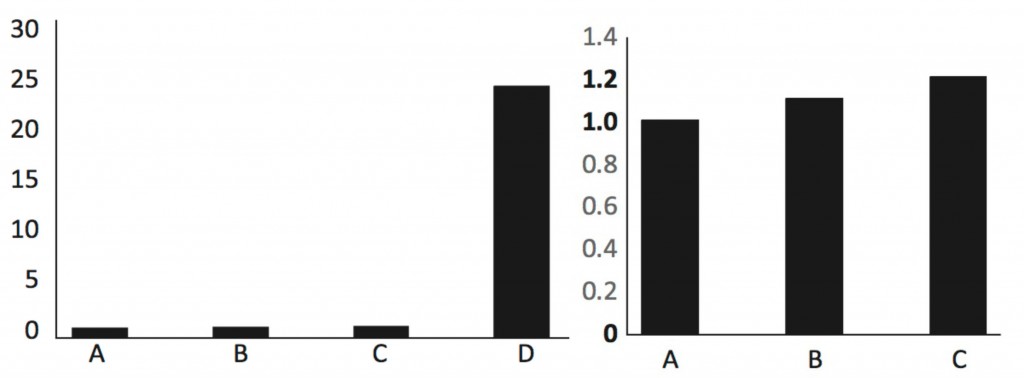
original (left) vs. doctored (right)
Here, we removed the last (very important) column that put the other columns into context. This is a great example of why you should find the original graph from the primary research article whenever you can.
The “zoom in on the axis” trick:
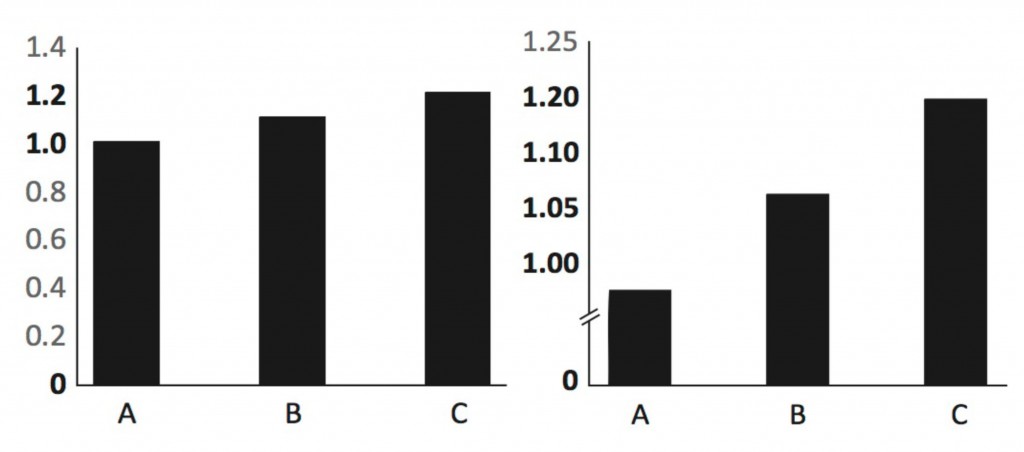
These two graphs have the same information. In the graph on the right, we’re zooming in on the top bit of information, making it seem like the differences between the columns are bigger than they are. Always check the numbers on the left side (y axis), and what those numbers stand for.
Finally, cover up the title, look at the graph and ask yourself what title you would give the data. If you don’t think you can conclude anything from the graph, you should be skeptical of anyone who claims they can. This applies to any kind of information, not just graphs!
4. Put the story into context
Now that you know what the study is saying, find out how it fits into the big picture. Make sure there’s more than one paper written about the subject and look for quotes from scientists who weren’t directly involved in the research. Different labs and researchers will often disagree about a scientific topic (which is why you should distrust the phrase “scientists say”). If you’re having trouble finding alternative perspectives, the Wikipedia page for the topic can be a good place to start, especially if it contains a “controversy” or “criticism” section.
5. Ask an expert
If after all this research and data analysis you still feel lost, find someone you trust and ask them about it! Is there a science blogger you like? Tweet at them. If you don’t have a favorite yet, ask us. We’d love to help and point you in the right direction toward solid resources. Nothing beats a real discussion (even over Twitter or email!), but you can also check out neutral, non-biased sites like Mayo Clinic.
More helpful resources:
- Google has some great tutorials on how to search. They give advice on which terms to choose and how to evaluate the search results.
- The PLoS journal series, especially PLoS Biology, is an open source, peer-reviewed journal series. All the articles are free, and many are written clearly, so read away!
- PubMed is another search engine for science journal articles.
- This guide shows you how to convert obscure technical measurements into simple terms.
- This list of “predatory” journals is a good guide to what not to trust. These journals will publish any research for a hefty price. They have no quality control.
- This list of 10 Questions you should ask to distinguish real from fake science is a great way to decide whether or not to trust a source.
- The UK National Health Service runs an excellent fact-checking website that can help you look behind the headlines.
- Here’s a great article detailing some of the biases and pitfalls in data analysis, especially for small studies.
Useful links from the comments (thanks guys!):
- For even more open access journals check out the Directory of Open Access Journals (DOAJ).
- For physics papers, you might have better luck over at arXiv, which archives reprints. Make sure the article has been “accepted for publication” in a journal, though!
- There’s also a preprint archive for biology papers called PeerJ Preprints.
- Pubpeer.com is a forum where peer-reviewed scientists comment on and critique recent published findings.
- This thorough post helps you tell “a good website from a crap website”.
*This threshold is most relevant to biomedical and basic biology journals. Other fields may have fewer citations, but that doesn’t mean that the research is necessarily untrustworthy. Impact factors certainly don’t tell the whole story about a journal’s value. If you want to know more, check out this article that delves into a little more detail.
Great post explaining common misleading ways to represent data! I’ve shared it on FB and Twitter. And, I’m sending it to my grad students, too. Good, basic information on how to evaluate the literature (or pseudo literature)…
Thanks so much! It’s great to see this guide (and the resources we link to) making it out into the hands of educators.
just to echo: thanks so much! Glad we could be helpful!
In the guide you state that you have to: Look for an impact factor of 5 or higher when deciding if a journal is trustworthy.
I want to pint out that the quality of the publication cannot be derived from the impact factor of the journal it is published in. To be able to judge tha quality of an article you should look at the article and all the metrics you can find. The journal impact factor should not be taken as a criteria for the individual articles.
for a good overview of quality open access journals you can go to DOAJ.org.
Definitely- there are tons of caveats to the Impact Factor, but I think it does help non-scientists put things in perspective a little bit — just having an impact factor means it’s not a predatory journal (those don’t last 3 years) which is an important topic but a little too much detail for the non-scientist.
So many people have tackled this issue so comprehensively, I added in a link to a PLoS discussion that I thought was accessible and pretty good – thanks for pointing this out! It’s something we discussed a lot but felt deserved its own post.
Since I am an expert, I usually:
(1) Look at author’s affiliations.
(2) Look at funding source.
(3) Look through all figures and arrive at my own conclusions.
(4) Read Results and Discussion and see if I agree with the authors.
Impact factors are calculated mostly by looking at how many times the journal gets cited. What’s missing is the fact that many times an author cites articles that they are disagreeing with, or proving to be flat out wrong. The metric is also prone to artificial inflation, since sub- fields will all cite certain journals and increase the metric that way.
I’m liking the whole article level metrics, but this has flaws as well. It tells you how many people looked at your article, but not how many people agreed with your conclusions.
However, the only real way is to do this “post publication review”. (We called it “journal club” when I was in college.) pubpeer.com is a new site that does this- only authors whose emails have been published in a peer reviewed journal are allowed to comment. (Here’s mine: http://pubpeer.com/publications/6123ABFE4A1BB6C628618D2F5EFAB1) This ensures that it’s not just some “random internet person” commenting- it’s an actual scientist who has published in the literature.
In general, the public should bear in mind that the scientific record- peer reviewed articles- is not a textbook. It’s a record of the conversation between experts discussing what they found out in the lab. Once the experiment is independently replicated and consensus is arrived at, then it turns into the textbook.
I think every middle school student should not escape math class without reading the book “How to Lie With Statistics” by Huff and Geis. The distorted graphs of this article get whole chapters.
Thanks for the book recommendation!
About quotes, I’d point out that a journalist can be very misleading by what they do and don’t quote. For instance, scientists typically give a balanced argument, whereas journalists can and do selectively ignore certain things which are said to reinforce their own agenda.
Interestingly, one place where this is quite apparent is in the (already somewhat controversial) reporting of studies on drugs, both illegal and pharmaceutical. Scientists interviewed have, in the past, frequently had quotes published about negative effects, while any statements they made on neutral or even beneficial effects have been left out entirely. Or vice versa, dependent upon the journalist’s agenda. A lot of scientists are actually on record as saying how tiresome they find this.
It’s sometimes worth hunting for a press release on some topics where you’re more likely to read the scientist’s full statement. That said, scientists aren’t immune to over-hyping their work in press releases either… One release last year conjecturing dinosaurs from space is a particularly emphatic example!
Oh, and one other thing. Regarding looking for journal papers, if you’re looking for anything physics-oriented, you may stumble across a preprint copy on arXiv (i.e. a paper which hasn’t been published yet). If so, check if it’s been “accepted for publication” in a journal. If yes, then it’s passed peer review and it’s trustworthy. If it still says “submitted”, then it may still be quite shambolic. If it doesn’t even say that, you may be better off ignoring it altogether.
Thanks for the informative comment! I definitely agree about misleading quotes. I’ll add arXiv to our list of helpful links.
You’re very welcome! Though if you add arXiv, make sure to remind people of that caveat. Quite frankly, any crackpot could put whatever they like on there, so you do have to make sure it’s been reviewed properly!
There’s also the new PeerJ Preprints, which is like arXiv for biologists. (arXiv is still mostly math & physics.) https://peerj.com/preprints/
I’d also like to echo some of the cautions about relying on impact factor. There is a huge variation from field to field as to what IF constitutes a reputable journal. In some fields, 5 may in fact be a plausible benchmark. In others (including my own field of aerospace engineering) anything over 1 may be perfectly solid.
You, and several other commenters, have made a good point about the variable use of impact factors. I’ve added a footnote, which should clarify things!
A further point on impact factors: They often falters when it comes to new journals. Many of the best new journals have been established to promote open access and fewer restrictions on making information available. The PLoS family of journals, mBio, and eLife all had significant credibility and impact from the first issue because of the people and organizations behind them. But the impact factor rating lagged several years behind.
that’s definitely true– but for every PLoS there are 10 predatory journals. That’s part of why we recommended the PLoS series at the end of the article.
Hopefully people will exercise “Step #5” when they run into these issues and now that scientists are more and more available on blogs and twitter, we can get around a lot of these journal-judging issues and encourage public-science interaction.
I want make an observation regarding data evaluation. It is true that a statistical ideal is to have as many samples as possible. However, it would be very impractical or simply impossible for most researchers to have a sample of hundreds or thousands of monkeys or cells. Most experiments in neuroscience, for example, call for reduced sample sizes due to the complexity of the experiments and the amount of resources (material or monetary) necessary for their completion. In these cases, a sample size of 6, for example, is acceptable. On the other hand, experiments based on the observation of wild animal populations will mostly have relatively small sample sizes too, specially when dealing with primates! Most of biology will have the same problem: sample sizes are small by necessity, not by choice, particularly in experimental biology (except perhaps in microbiology or work specifically dealing with tissue morphology). Regular readers should also know that there are statistical tools that allow one to compensate for this, which is not equal to cheating, although the line can be very thin at times and some people are particularly good at passing their cheating as true science. Ethics plays a very important part in this, but also knowledge and commitment from the reader.
Regarding the impact factor, I just want to point out that the scientific communities outside the U.S. and maybe some european countries, suffer the negative consequences of this system more. Science is subject to fashions and trends, but also to racism. The wrong perception that a given country (latin american, for example) lacks the facilities or resources necessary for certain types of science leads to the rejection of good papers on a regular basis. Scientists everywhere should try to make their work available to as wide an audience as possible, but this is not always facilitated by the scientific community itself. In practice, science is not a democracy.
On both points:
First, we are making this article for non-scientists, without the time/care/background to have their own Journal Club inside their head (I don’t think I even always have the time/care/background, depending on the paper!). Small sample sizes need caution and I hope that’s what came through in our article… and the conclusions drawn need to reflect those sample size differences. We can’t say “all men love beer” by asking 2 or ever 200 men, but we can get statistically close to evenly sampling the population, and get to a point where we can say “with 95% confidence, most men like or love beer” (or whatever the study is).
I think everyone’s bringing up great points, about the Impact Factor and they deserve their own space on the blog… we’re planning to address the impact factor question in more depth in a separate post at some point, and will definitely try to include a Storify of Twitter responses and/or a summary of these comments here. But again, this is for NON scientists– and I know my mom has come to me with articles from terrible journals (0.3 Impact Factor, bunch of junky articles) and she sees “peer reviewed” and trusts it. I’d rather people continue to be skeptical than put their stock in something. I hope that came through! Regardless, look to our next article on this!
We’re all hoping the system improves in the coming years, and I have hope that it will– especially as more and more of us demand accessible information, in whatever form that takes.
Thanks for reading and for your comment! Good points.
Brilliant article, both with the step-by-step description of how to critically evaluate scientific writing and the additional links/resources. Thanks very much for writing this out!
Thanks Erin! We’ve been really excited and humbled by the responses to this post- I actually met a student who had to read it for homework! It’s both a little unbelievable and a lot awesome. We had fun writing it!
Glad you liked it! Thanks for the kind words. 🙂